thx for the input, I haven t been to their homepage for a long time,
but I remember another poage for worthwhile consideration called
Justonics, you might know?
http://www.justonic.com/default3.htm
this works the other way round, unfortunately not for free.
You dont analyze the swar, shruti, etc but you let the computer
figure out the correct shruties instantly when you hit a keyboard
swar- that is called "justonics", this way you do not need to analyze afterwards.
Just in case one wants to save on time?:o
Pitch Analysis - A fun tool to investigate Shruti in CM
-
cmlover
- Posts: 11498
- Joined: 02 Feb 2010, 22:36
Super Arun!
I just installed it and tried it on the MS clip. Worked like a charm. I will explore the potential gradually. It is too complicated for me at present ! Do send me your 'pitch detector' plug-in to install. I will try it along with the vamp.
Thank you very much. We are getting technical with your technical know-how!
-
vasanthakokilam
- Posts: 10970
- Joined: 03 Feb 2010, 00:01
Arun, Great find. Thanks for the little tutorial on how to use it. It worked great. I also like the 'points' plot much better.
Uday, I looked at your flute bit on the sonic visualizer. Wow, your frequencies and pitches are right on target.
The MSS and Pitchappa combination is also quite illustrative. Now it is easy to see the similarity between the two even in the presence of noise in the MSS recording.
Arun, couple of questions..
1) How do I adjust the scale values of the Y axis? For the MSS, Pitchappa combination, due to all the higher partials, the base one scrunched at the bottom. If I tried logarithmic scale, then it gets scrunched at the top. I would prefer to look at it linearly by me just defining the min and max freq for the Y axis.
2) How do I interpret the dB values. I know they are relative to a standard but when I look at the wave form in this tool ( and other tools as well ), they show either 0 or negative.
Thanks.
-
vasanthakokilam
- Posts: 10970
- Joined: 03 Feb 2010, 00:01
>Also can we get rid of the wave and look at only the plot of the fundamental without any clutter?
Yes, that is possible and I also like to look at it that way. The tool is quite good at that. They are all organized as layers vertically stacked on top of each other. To remove the waveform, click on the third pane ( the third button on the top left hand side ) and at the bottom, click on the toggle button 'Show' to go back and forth between 'showing' and 'not showing' the waveform.
Yes, that is possible and I also like to look at it that way. The tool is quite good at that. They are all organized as layers vertically stacked on top of each other. To remove the waveform, click on the third pane ( the third button on the top left hand side ) and at the bottom, click on the toggle button 'Show' to go back and forth between 'showing' and 'not showing' the waveform.
-
vasanthakokilam
- Posts: 10970
- Joined: 03 Feb 2010, 00:01
Yes, your right ( pardon the pun(unfortunately VK you do not know to distinguish the right from the left
I am catching myself a lot lately making this kind of goofs. Another one is, while typing, I just miss a word. Quite troubling. Now I proof read every little thing I write.
-
vasanthakokilam
- Posts: 10970
- Joined: 03 Feb 2010, 00:01
True to the new title of this thread, this is getting to be fun..
Look at Pitchappa's or Uday's mohanam with the Spectrogram layer using the following setting: Bins = Frequencies and Log. It is quite interesting. You can see a smoother graph of the contour and all the harmonics.
CML, I found a way to make it display the Y axis at lot more granularity. In fact, it has more than I expected.
Here is what I did.
1) Import an audio file.
2) Add the Spectrogram layer from the layer menu. Set the settings: Bin = frequencies and Log
3) Now it displays the Y axis with finer granularity. In addition, it shows the Piano Keyboard layout as one of the Y axis. That is a nice touch as well when you pick the Log option.
4) Now do the transform to pitch
5) If you do not like to see the waveform or spectrogram view, tab to that view and turn them off.
6) end result you will have the pitch curve alone with the various Y axes ( freq, piano keyboard etc. )
This tool is quite feature rich and powerful.
-
cmlover
- Posts: 11498
- Joined: 02 Feb 2010, 22:36
-
arunk
- Posts: 3424
- Joined: 07 Feb 2010, 21:41
Good catch vk. I was wondering about this myself. Also db values are "relative" to a reference value for the amplitude of the waveform. Here I think the reference value is 1.0 (maximum possible value) and so all values are negative - IIRC, the values are 20Log(A/Aref), since Aref = 1.0, they are 20LogA. A is such that -1.0 < A < 1.0 and so LogA is always negative. It is just a log scale of the amplitude.
cmlover: What is portable here is just the core algorithm for pitch detection (wrapped into a VAMP plugin). The calibration of the y-axis is still "automatic" (based on results from the pitch detector) and so is taken care off by the Sonic Visualizer. Although the plug-in has some control not that much. What they need to provide is zooming (and scrolling) in the vertical direction also.
Arun
-
vasanthakokilam
- Posts: 10970
- Joined: 03 Feb 2010, 00:01
Arun, thanks for the explanation on the dB values and that makes sense.
I am trying to correlate this with other ways in which dB is represented.
1) When you say that the Amplitude can vary from -1 to +1, that is the height of the wave form. This may be too basic a question, but is this the same negative amplitude that a pure sine wave takes as it sweeps down the zero line? If I play a single note, will there be areas of all negative amplitudes? If so, would it be audible? ( I am curious if negative amplitude has anything to do with audibility or not ).
2) In normal terminilogy, people speak of deciBell values in positive numbers. The higher it is, higher the volume. 0 dB is the smallest volume we can hear and something that is uncomfortably loud is 120 dB. How do these numbers correspond to the above 1 based range? Hence the confusion.
3) I looked up what are typically used in the audio industry. There are dBv (1 millwatt - 0dB ), db SPL ( 0 dB is smallest perceptible sound pressure level ), and other dB based on voltage ( say 0 db = .775 volts etc. ). Along those lines, what is +1 signify to be treated as 0 dB?
4) The reason I am trying to understand this is, in those property settings that refer to dB values, they are actually gains to be applied. I am quite confused about what to enter. The tool says that the range is -25 to +25. Without knowing the basis for this, it is hard to know what a gain value of -12 actually does?
See if you can clarify all this confusion for me. Thanks.
-
uday_shankar
- Posts: 1479
- Joined: 03 Feb 2010, 08:37
Don't know much about audio signals (or anything for that matter!) but here is a rough, sequential way of understanding sound, waves, sinusoids, etc.., much of which you may already know:
1. A body vibrating regularly (i.e., a physical body vibrating according to some form of simple harmonic motion that satisfies second order differential equations of the type d2x/dt2 - x = C) in the range of 20Hz to 20000Hz when in contact with the atmosphere produces sound waves. Eg.. a string, pipe, musical voice, etc.. in a room.
2. The generated sound wave in air does two things a) creates a small pressure wave where the waves produce small regular disturbances of pressure above the undisturbed normal pressure in the room b) the sound propagates from its source in the form of spherical transverse "waves", which are very small displacements (maybe a few microns) in time of the particles in the air above their normal position (CAUTION: do not confuse these waves with the sine wave, although the may be, we'll come to that later...!).
3. The pressure wave can be picked up by a sensitive transducer, i.e., microphone, which can produce a small current/voltage proportional to the pressure changes. This is amplified, filtered, etc.. to finally give us a voltage that is bipolar, i.e., symmetrical about 0 Volts.
4. Now back to sound waves....When dealing with sound waves (and consequently the voltages generated by transducers in proportion to the intensity of sound waves), we find that our interest usually lies in orders of magnitude rather than linear changes...eg., intensity, pressure, etc..
5. The logarithm is a mathematical function that translates multiplicative property to additive, thereby helping us compact the large range of information into a smaller range.
6. A few quick logarithm fundas (very limited! ):
a) If you define 10^x = b, then x is defined as "log b to the base 10".
b) It automatically follows that the logarithm of a negative number does not exist.
c) Clearly the logarithm of 1 is 0.
d) The logarithm of quantities less than 1 are negative and greater than 1 positive.
e) log(a^2) = 2 log(a), the power rule
7. A decibel is a unit of relative power expressed by 10*log(P1/P0). In many physical systems, power is the squared of the the more fundamental quantity. For example, acoustic power is proportional to square of the pressure, the power in an electric circuit is proportional to the square of the voltage or the current, etc.. Hence, when we express those quantities in decibels, we have to square the quantities. For example for voltage we say 10*log(V1^2/V0^2) or 10*log((V1/V0)^2). Applying the power rule of logarithms, that's the same as 20*log(V1/V0). Hence, we "define" decibels often loosely as 20*log(x1/x0). Now if the quantity (x1/x0) is < 1 then decibel will have a negative value (make a note of this). In all of the above cases, the deniminator is the "reference" - in the case of acoustic power the power of background noise, in voltages some reference voltage and so on...
8. As an aside, because audio/radio systems were first used to design amplifiers, the db scale is still widely used in electronics and DSP. But for some applications, a linear scale is better...for example, showing the roll-off, passband ripple, etc.. of the frequency response.
9. Now back to sine waves...The electronic system translates the pressure waves to a voltage that varies in time about 0V (the variation can be about any DC voltage value, but it can be reduced to a variation about 0V by a process known as high pass filtering). This variation is harmonic, i.e., the value of the quantity changes in time according to a sine function (with superimposed harmonics, etc..), i.e. y = f(x) where f(x) = sin(x) . Hence their representation as a "sine wave".
10. The amplitude of these waves can be expressed either as a peak to peak value or an root mean square value (RMS). In either case, it is a positive number.
11. Digital systems "sample" these continuous sine waves at a sufficiently high regular rate (often orders of magnitude higher than the frequency ranges of interest) to be able to faithfully represent them and analyze them. The frequency at which they sample these continuous waves is called sampling frequency f and the interval between successive samples is the period T.
12. The pitch tracker algorithm in your program operates on regular time windows of these sampled sinusiodal waves under the presumption that there's a dominant frequency (i.e., pitch) in each window. It looks for the frequency with the highest amplitude in each window (there may be other empirical tricks, etc..). At this point we forget about ampitude and note down the frequency. The plotter then plots these frequencies against time as a "pitch track". Note that at this stage there's no "amplitude" information - only a plot of frequency vs time.
13. A pitch track also lends itself to a logarithmic scale on the Y axis because musical perception of pitch is relative. For example an octave is *2 and so on. Therefore the pitch track can have a log scale. If the quatities seen on the pitch track are negative, then it means all the relative frequencies are fractional values. This means all the quantities are being divided by some high value to generate fractional values.
Ok, enough blah blah.. I downloaded the program but haven't had the time to blunder through it. I will when I get time, since all of you are raving about it.
Last edited by Guest on 21 Jan 2008, 21:47, edited 1 time in total.
-
arunk
- Posts: 3424
- Joined: 07 Feb 2010, 21:41
vk
Warning: i am even less knowledgeable on this than Uday - he atleast does some of this for his living. I apologize for any goof-ups. Please corroborate by reading other material.
(i have edited to hopefully correct misinformation in earlier version regarding value of signal and amplitude)
Dont get caught up in the actual value of the signal - it is all normalized, and hence it is all relative. This is one of the confusing things to most of us when we start out. The "exact" value of the original signal over time is not represented, neither is it necessary nor that meaningful. This is because the reproduction of the signal is always entirely dependent on the amplication system, stereo etc. So a normalized signal is what is represented. So the actual value of -1, 1.0 here are not that meaningful except they serve as the limits.
Also (unless I am mistaken - not 100% sure) dont get caught in the negative value as it is a reflection of the variance phase of the sinusoid (???). Now as Uday says if one simply took 10*log(A), and A varied between 1.0 and -1.0 we have a problem for values 0 and less as log would be meaningless. Here if you observe closely they have simply adopted a very large negative value of -1000db when value of signal reaches zero as it crosses over. For all other values, they simply have taken the mod. So here db is 10log( |A|) (A is value of signal at that instant - not ampl).
In digitized sound waves, you have "discrete levels" for representing value of the signal at any discrete point in time. How many discrete points in time there is dependent on the sampling rate. If you have a 8-bit WAV/AIFF (or any digital) file, - you have 256 possible levels (2^8) for each sample i.e. each snapshot of the signal at each snapshot in time. These 256 values are represented 0 through 255 - and this is the normalization. So if you take say a pure sine way that varies over time between 4.0 and -4.0 (at the frequency of the sine wave). When this gets represented in say a 8-bit WAV file, 127 stands for the maximum (i.e. 4.0) and -127 for minimum (i.e -4.0). It gets normalized that way. Of course, when you take the sine way and play it on any system, you dont necessarily reproduce a signal that exactly, always fluctuates 4.0 to -4.0 But you capture the exact variance of the signal over time.
Not sure if that made sense. I have a feeling I am shooting off garbage from my mouth in this case
Arun
Last edited by arunk on 21 Jan 2008, 22:36, edited 1 time in total.
-
uday_shankar
- Posts: 1479
- Joined: 03 Feb 2010, 08:37
-
arunk
- Posts: 3424
- Joined: 07 Feb 2010, 21:41
The pitch trackers work either in frequency domain or the time domain. In the frequency domain, the frequency with the highest amplitude is not always (more commonly than we may suspect) not the pitch. It frequently is one of the harmonic/partial. So proper pitch trackers use other ways. One way is to looj at the spacing between the peaks. For monophonic they will equal to the pitch (even if a peak here and there may be missing). The "best algorithm" one used in this program (YIN and YIN with FFT) - works on a fairly simple but effective premise - although hard to state it in less technical termsUday_Shankar wrote:The pitch tracker algorithm in your program ... looks for the frequency with the highest amplitude in each window (there may be other empirical tricks, etc..). .
Last edited by arunk on 21 Jan 2008, 22:24, edited 1 time in total.
-
uday_shankar
- Posts: 1479
- Joined: 03 Feb 2010, 08:37
Arun
As usual you're shooting faster than reading. Y is not the amplitude of the sinusoid. It IS the sinusoid. The amplitude is 2A, a positive number.
As usual you're shooting faster than reading. Y is not the amplitude of the sinusoid. It IS the sinusoid. The amplitude is 2A, a positive number.
Last edited by Guest on 21 Jan 2008, 22:36, edited 1 time in total.
-
arunk
- Posts: 3424
- Joined: 07 Feb 2010, 21:41
There is no fixed/ideal limit. It depends on the signal. But between 10-50ms is what I have read.cmlover wrote:Could you tell on what chunks (50 ms ?) the fundamentals are calculated?
Here if you look at Advanced, you see that per "block" there are say 2048 frames/samples (by default). For a sampling rate of 44100 (44.1 KHz), this would be 2048*(1000*/44100) = 46.43 ms. For smaller sampling rates, using 2048 would result in larger time windows. So if you have a signal that maybe changes pitch faster, the pitch tracker results may be less accurate at those transitions.
Arun
-
arunk
- Posts: 3424
- Joined: 07 Feb 2010, 21:41
Uday_Shankar wrote:Arun
As usual you're shooting faster than reading. Y is not the amplitude of the sinusoid. It IS the sinusoid. The amplitude is A, a positive number.
I have (hopefully correctly)) fixed the earlier post - to state value of the signal at a point of time wherever it applies (rather than amplitude)
Arun
Last edited by arunk on 21 Jan 2008, 22:41, edited 1 time in total.
-
uday_shankar
- Posts: 1479
- Joined: 03 Feb 2010, 08:37
This paragraph is a mass of confusion that should be disregarded. I have no idea what it means. Maybe I should look at the software and then clarify. Could somebody tell me what to look for and where ?arunk wrote:Also (unless I am mistaken - not 100% sure) dont get caught in the negative value as it is a reflection of the variance phase of the sinusoid (???). Now as Uday says if one simply took 10*log(A), and A varied between 1.0 and -1.0 we have a problem for values 0 and less as log would be meaningless. Here if you observe closely they have simply adopted a very large negative value of -1000db when value of signal reaches zero as it crosses over. For all other values, they simply have taken the mod. So here db is 10log( |A|) (A is value of signal at that instant - not ampl).
Arun
-
arunk
- Posts: 3424
- Joined: 07 Feb 2010, 21:41
Yes it specifically applies to the software (sonicvisualiser). Once you import waveform, you change its scale (tab #3 assuming all you did was bring it up and imported a waveform) to db. The resultant waveform is a db scale of the signal value (from waveform) over time. The db values seem to follow the formula I quoted.
Arun
Arun
Last edited by arunk on 21 Jan 2008, 22:50, edited 1 time in total.
-
uday_shankar
- Posts: 1479
- Joined: 03 Feb 2010, 08:37
Ok, I looked at the time-domain waveform of mss-mohanam.wav according to Arun's recommendations above.
Some observations:
1. Firstly, a db scale for the time domain waveform sucks and only highlights system limitations, quantization errors, etc.
2. As Arun says, It indeed computes 10*log |x| where x is the signal. Such a calculation is quite weird and useless.
3. With the above calculation, at every zero crossing (i.e. when the waveform goes from +ve to -ve and vice-versa) you should have negative infinity (value of log 0), which defaults to -1000db (a reasonable thing to do) as Arun says.
4. But you don't see -1000db at every zero crossing, only in some ! although in all cases you do have a sharp dip to a minima at the zero crossing, followed by a sharp rise but this minima is not -1000 db. This anomaly is due to quantization errors. If you notice these minimas in the file mss-mohanam (Arun's section), many of them have a value of 0.0078125. This corresponds to the of a 9-bit overflow minus 1 ( 0.0078125 * 65536 = 512). It's some integer to double conversion devil along with some A/D bit errors/noise. In any case floating points are notorious for rarely coverging to a total zero and programmers know better than to test for a condition like if (x == 0.0) .
5. So, not only is -1000db a zero, but so is -21.07 db and every other places where you have the minima.
6. Lastly, looking at the waveform with a db scale is an abomination ! Don't.
Last edited by Guest on 22 Jan 2008, 00:23, edited 1 time in total.
-
vasanthakokilam
- Posts: 10970
- Joined: 03 Feb 2010, 00:01
Uday, thanks for the primer.
I may still have some questions on relating that to using the tool.
I am more confused now about the dB.
I understand amplitude ( peak to trough and RMS makes sense, that takes care of my question about negative amplitudes ) and I understand frequency. Now what is the signal value?
I may still have some questions on relating that to using the tool.
I am more confused now about the dB.
I understand amplitude ( peak to trough and RMS makes sense, that takes care of my question about negative amplitudes ) and I understand frequency. Now what is the signal value?
-
uday_shankar
- Posts: 1479
- Joined: 03 Feb 2010, 08:37
-
vasanthakokilam
- Posts: 10970
- Joined: 03 Feb 2010, 00:01
Ok, got it.
Now, when I add the spectrogram, the db scale on the Y axis changes to dBFS with a top value of 0 and others all negative value. I looked up what dBFS means here http://en.wikipedia.org/wiki/DBFS . "a signal that fluctuates randomly between two neighboring 16-bit quantization levels will measure at −96.33 dBFS when the full-scale square wave convention is used.". This means the full dynamic range for digitised 16 bit signals is 0 to -96 dBFS. This matches with the scale the tool shows for dBFS.
This makes sense now and answers my original question as to why all the dB values are negative. I was not sure then what 0dB meant. Now I know it means MAX in the dBFS scale. It is counter intutive at first but understandeable now.
With this understanding, there is one another confusion with this tool. In the property window to the right, if you double click the property setting thing to the righ of the dB scale, it asks to specify a value between -25 to + 25. What is that dB scale based on? 0dB is 1 volt?
If I set those to different values in the range of -25 to +25, it changes the color coding that is associated with the dBFS ranges. The colors are used in the spectrogram view. If you can play with this and explain what this means, that will be great. Especially how dbFS and dbV scales correlate with each other and where and when to use them in using this tool. Also there are two check boxes for normalizing columns and normalizing visual areas. I would like to know how they can be used or what is the purpose behind them.
Actually, what I wanted to do is to look at only the first ( base ) and may be the second harmonics. So I thought if I specify a dB range with in certain values, it will cut out all the higher partials since they would not satisfy the threshold I set for the dB. That may not be what those settings are for since that did not quite happen in my limited experience with this tool. So if there is any other way to do that, that will be great too.
I am looking forward to all your tips and tricks about this tool once you get to play around with this.
-
vasanthakokilam
- Posts: 10970
- Joined: 03 Feb 2010, 00:01
A few things I found with the tool.
1) The pitch contours of an Alapana shows up very well with this tool for obvious reasons. Not much polyphony, there are a lot of sections where there is only one melodic line. Even when the violin tries to shadow there are enough separate parts to get a meaningful idea on the contours of the raga including the gamakas.
2) At this level, atleast for me, the swaras completely disappeared from my mind and only the contours were in focus as I followed along listening to the song. It is quite a different ( and surreal ) way ot enjoying a raga alapana. With the corner of your right eye, you see a long straightline followed by an oscillatory pattern which sets up the expectation of what is to come ( a kArvai followed by a gamakam ). I was doing that for a Thodi alapana of MSS and it was quite a treat..
3) With this pictorial representation, the overall plan and structure of the alapana, even the ones that are 5 to 7 minutes long, is visualizable in a congnitively compressed form. I am not sure if I am conveying it properly but I leave it at that for now.
4) If for some reason you want to see what swara it is, just pause the music in the tool, click on the selection tool ( the arrow that is available at the top tool bar ). When you are in that spectogram layer, the selection tool gives you a movable vertical and horizontal line with your cursor. You align it to the swara and read off the swara from the piano keyboard. In many places, it also gives you the bin frequency and the note name at the top right hand corner.
-
cmlover
- Posts: 11498
- Joined: 02 Feb 2010, 22:36
I agree with you totally VK. it is indeed a unique experience to hear the music understanding what is happening and what will happen. The gamakas come to life when you follow them visually (especially for me whose hearing is poorvasanthakokilam wrote:A few things I found with the tool.
.....
2) At this level, atleast for me, the swaras completely disappeared from my mind and only the contours were in focus as I followed along listening to the song. It is quite a different ( and surreal ) way ot enjoying a raga alapana. With the corner of your right eye, you see a long straightline followed by an oscillatory pattern which sets up the expectation of what is to come ( a kArvai followed by a gamakam ). I was doing that for a Thodi alapana of MSS and it was quite a treat..
.
this is indeed a great tool tool for enjoying CM seriously. Though many of the discussions of Uday were beyond my ken (being a physician than a physicist
Thanks a million Uday/Arun/VK for this wonderful educational treat....
-
arunk
- Posts: 3424
- Joined: 07 Feb 2010, 21:41
I dont know if there are "fool-proof external" means for this cmlover. Like I said before, based on the tune - i figure out the sa and hence where in the audio sa figures.cmlover wrote:by knowing the shruti of the singer (which is a bit tough (and I hope Arun will educte us sometime!)).
Once one gets that, then if you have the display shows the keys, it is easy to know the kattai (of course smany people can sense the kattai just based on intuition).
In any case,assuming you are having trouble with the above, the following hints may be useful in arriving at sa:
1. Sa (madya or tara) usually occurs at very end of sections e.g. pallavi- but of course not always the case. It may also be pa. And of course when it occurs it is a long "rest". So look at how singer ends pallavi part i.e. before starting anupallavi, and/or before starting charanam, and of course the very end of alapana. The chances of him/her ending in sa is very high, and the chance of it being pa is next highest.
2. sa in almost all cases would be close to a piano key freq - basically because most people sing AT some kattai which of course is a piano key freq.
3. Males usually 1-2 kattai, unless you are following someone who has a very high pitched voice (old ARI, musiri, MVI) or of course a very bass voice (MDR). Females usually 4.5 - 6 (5 being common). If following someone who is high pitched, it would be 6. If you are following someone who is old (say late DKP), then it may drop below even closer to males.
Arun
Last edited by arunk on 22 Jan 2008, 22:46, edited 1 time in total.
-
cmlover
- Posts: 11498
- Joined: 02 Feb 2010, 22:36
Thanks Arun! I am almost using your algorithms. I look for also long resting (nyaasa) svaram and if it is at the comfort level of the singer take it to be the aadhaara Shadjam! It works out usually when I also know the raagam whence I pin down the other notes. Still I need a visual help rather than use my ears which this software helps a lot. This technique also helps with instruments such as flute violin and nadasvaram. I am still a long way from 'svarapudutthufying' a phrase which requires an intimate knowledge of the sanchaaram. One of these days ...perhaps!
-
vasanthakokilam
- Posts: 10970
- Joined: 03 Feb 2010, 00:01
Another interesting thing that this tool reveals is, if you analyze some western songs ( more of the jazzy type if not jazz vocal itself ), it shows a good deal of gamakam type ornamentation but it sounds quite different from Indian music. For example, I looked at ( Sinkin' Soon/Not Too Late/Norah Jones) there are quite a few smooth slides up and smooth slides down type of gamakams. And it is hard to see any straight note execution. I guess we all knew this, it is not the gamakam vs straight notes that gives CM its unique color, but the specific type and contour of the gamakams.
Anyway, just an observation. I will have to see how a straight pop music looks in this tool.
Anyway, just an observation. I will have to see how a straight pop music looks in this tool.
-
arunk
- Posts: 3424
- Joined: 07 Feb 2010, 21:41
slides are definitely more common in many forms of music. What you may find in western music, is there would be more discrete/disjoint notes than cm.
But I should also mention that when you look at pitch trackers, it is possible that may show continuity of pitch even when it is not there (this is true even for cm).
For example, let us say you observing a 1.5s (1500 ms) audio, where
1. 1st note is sa (say C) and is 0.75s (750ms) long
2. Second note is R2 (say D) that is also 750ms long.
So a S R2 where S is 750ms and R2 is 750ms. These two are sung/played as two discrete notes i.e. no slides between them.
Let us say that pitch tracker analyzes this in 50ms windows, and the windows overlap each other (to capture pitch transitions this sliding window is always done). This is such that first window is of time index range: 0-50ms, second is 10-60, third is 20-70 etc.
Now the following windows will all contain the exact moment of pitch transition i.e. at time index 750ms:
710-760
720-770
730-780
740-790
During all these windows, the signal has C pitch for part of the window, and D for rest. I am not 100% sure of this but I think, for these windows, the pitch that most detectors will arrive at would fall between C and D, closer to C for earlier windows, and closer to D for later windows. Hence when you look at the pitch track - you would find a C pitch upto 700, and then a curve up from C towards D which it would reaches at 750 (i.e for window that starts from 750). Just it may show a small continuity when it does not exist in the actual signal.
But of course this should not be taken to imply that every continuity shown is an error. If you really did have C going D as slide - say 750ms of C, then a conscious slide up for about 200ms reaching D at about 950ms, then the pitch track would show the slide. Its just that the slide would not be captured exactly (but that is true for other reasons also)
Arun
-
vasanthakokilam
- Posts: 10970
- Joined: 03 Feb 2010, 00:01
Thanks Arun. I understand. That should be kept in mind while interpreting the music. Definitely the oscillatory gamakams with high amptitude ( as in Thodi ) is not there in the few WM pieces I looked at.
Back to CM, with this kind of waveform and pitch tracker, I think we can more concretely define the various gamakams, atleast for educational purposes. One Kambhoji prayogram I looked at is quite dazzling and it will take 1000 words to describe it, true to the saying a picture is worth 1000 words!! In that sense, the complexity is no longer incomprehensible and it is less intimidating. Of course, there is a danger to trivialize it as 'it is just this pattern' but as long as we keep from falling into that false perception of simplicity, this kind of pictorial description makes the music more accessible.
Back to CM, with this kind of waveform and pitch tracker, I think we can more concretely define the various gamakams, atleast for educational purposes. One Kambhoji prayogram I looked at is quite dazzling and it will take 1000 words to describe it, true to the saying a picture is worth 1000 words!! In that sense, the complexity is no longer incomprehensible and it is less intimidating. Of course, there is a danger to trivialize it as 'it is just this pattern' but as long as we keep from falling into that false perception of simplicity, this kind of pictorial description makes the music more accessible.
-
Suji Ram
- Posts: 1529
- Joined: 09 Feb 2006, 00:04
http://www.sendspace.com/file/8rj7di
Here's a small clip I present for analyzing gamakas. I just started learning this kriti so it may not be perfect. I originally played in D# 2.5 but chnaged to C
This software works like cutie !! The gamaka patterns come out so well
Ill try and load the image, but you can also try it out.
Here's a small clip I present for analyzing gamakas. I just started learning this kriti so it may not be perfect. I originally played in D# 2.5 but chnaged to C
This software works like cutie !! The gamaka patterns come out so well
Ill try and load the image, but you can also try it out.
Last edited by Suji Ram on 23 Jan 2008, 13:02, edited 1 time in total.
-
vasanthakokilam
- Posts: 10970
- Joined: 03 Feb 2010, 00:01
CML, Since you asked, this is what caught my attention when I was looking at Suryaprakash's Kambhoji alapana for Marakathavalleem. It sounds quite grand. I realize that without accompanying audio, this does convey the full story.This is a commercial track, so I do not want to post the clip for this. I have marked the Sa, Pa, Sa' and you have the frequencies and you can have fun trying to reverse engineer the music If it is not clearly visible, save the image and zoom it. I have not figured out how to get a clean image out of the tool. This is just a screen shot.
The traversal is up and down as shown by the pyramid like formations, but the sub-patterns within the traversals creates the kambhoji effect and grandness. So there is an overall trend and within that trend there are zig-zag patterns but both the overall trend and sub trend changes quite a bit within this 20 second interval. I do not want to overanalyze this, so treat this as just an illustration of a 20 second segment of Kambhoji, one face of the raga as interpreted extemporaneously by the artist. ( I am posting this without getting permission from artist Suryaprakash, hope he does not mind. It is for illustrative and educational purposes ). I could have picked from any such patterns, so this is just an example. If you have the commerical track, it is from around 4:20 to 4:40 of the alapana, almost towards the end of the alapana.

The traversal is up and down as shown by the pyramid like formations, but the sub-patterns within the traversals creates the kambhoji effect and grandness. So there is an overall trend and within that trend there are zig-zag patterns but both the overall trend and sub trend changes quite a bit within this 20 second interval. I do not want to overanalyze this, so treat this as just an illustration of a 20 second segment of Kambhoji, one face of the raga as interpreted extemporaneously by the artist. ( I am posting this without getting permission from artist Suryaprakash, hope he does not mind. It is for illustrative and educational purposes ). I could have picked from any such patterns, so this is just an example. If you have the commerical track, it is from around 4:20 to 4:40 of the alapana, almost towards the end of the alapana.
-
uday_shankar
- Posts: 1479
- Joined: 03 Feb 2010, 08:37
I haven't heard any suryaprakash recordings, commercial or otherwise, so we can indulge in an interesting exercise  .
.
I'll try to translate the graph into a kamboji on the flute or chitravina when I get time.
vk can listen to it and see if it sounds anything like the original. If so, the graph is really an analog to the musical experience.
I'll try to translate the graph into a kamboji on the flute or chitravina when I get time.
vk can listen to it and see if it sounds anything like the original. If so, the graph is really an analog to the musical experience.
-
vasanthakokilam
- Posts: 10970
- Joined: 03 Feb 2010, 00:01
-
arunk
- Posts: 3424
- Joined: 07 Feb 2010, 21:41
vk -
I think I found out how to calibrate the vertical axis. It is a bit subtle.
1. Import Audio
2. Add spectrogram (to add the freq scale and keys)- but then change color to black on white, and then click on "Show" to toggle and remove the spectrogram (i.e black part). The black on white, allows background to remain white. This would be Tab #4
3. Now add Layer with Aubio Pitch Detector (i must again mention - what a pitch detector!) - This would be Tab #5
4. Now go back to spectrogram i.e. Tab 4. NOTE FOLLOWING CAREFULLY
You will see two "scrollbar like thingumajigs" at the right bottom of the screen. One is vertical and one is horizontal. The horizontal one controls scale of x-axis and the vertical one controls scale of y axis.
This "fancy scrollbar" has a dark dot/line INSIDE IT, and that controls the scaling factor. It initially is at the top. You click on the scrollbar, and drag down, to scale as if to zoom-in. When you do that you fill find that the dark-dot/line moves down. But ALSO note to the immediate left of the scroll bars contains a shade area with TWO dark lines it in it. These supposedly indicate the the visible range. As you drag down and increase the zoom factor, these lines start to get closer - that is because as you zoom-in the graph is showing a smaller porrton of the enture scale.
Now as you drag down and zoom-in, what happens is that the graph portion continues to show the high end of the spectrum (i.e. freqs 10k) etc. and thus our pitch curve usually is off the screen (at the bottom where the 100-500Hz) is. But you can also click between those two lines in the shaded area to the left of the "fancy scrollbar" and move that DOWN. That will make the graph portion start to focus on lower freqs. You move it down all the way so that the pitch curve appears. Also, apparently you can also click on the graph portion and also move it up/down and a small dark dot now to the RIGHT of the fancy scroll bar moves.
Here is an example:
This is way too subtle
Arun
-
vasanthakokilam
- Posts: 10970
- Joined: 03 Feb 2010, 00:01
Thanks Arun. That is a great find. I have not had time to play with it fully. For now, I just double clicked on that little rectangle to the left of the vertical scroll bar and it gave me a dialog box to enter the min and max range for the frequency axis. It then showed me the graph only for the range I specified. That is great. But that went away once I scrolled vertically. I need to read carefully what you wrote.. later on tonight...
-
cmlover
- Posts: 11498
- Joined: 02 Feb 2010, 22:36
Yes Arun! It works though quite clumsy controls. There is no fine tuning possible.
Thanks Suji! Will start using it to play with gamakas. We need to get the timelines for gamaka analysis. Just summarize the special gamakas that you have employed with time lines so that we can zoom in!
VK
Without the audio and with the fuzzy picture I am totally lost. I am unable to understand what your are raving about
Maybe I should wait for Uday to recreate the sample visually with audio!
By the by there is no harm in posting very small clips even from commercial pieces (with acknowledgement) for educational purpose. I am sure the artistes will not object if it helps understand CM better!

-
Suji Ram
- Posts: 1529
- Joined: 09 Feb 2006, 00:04

CML
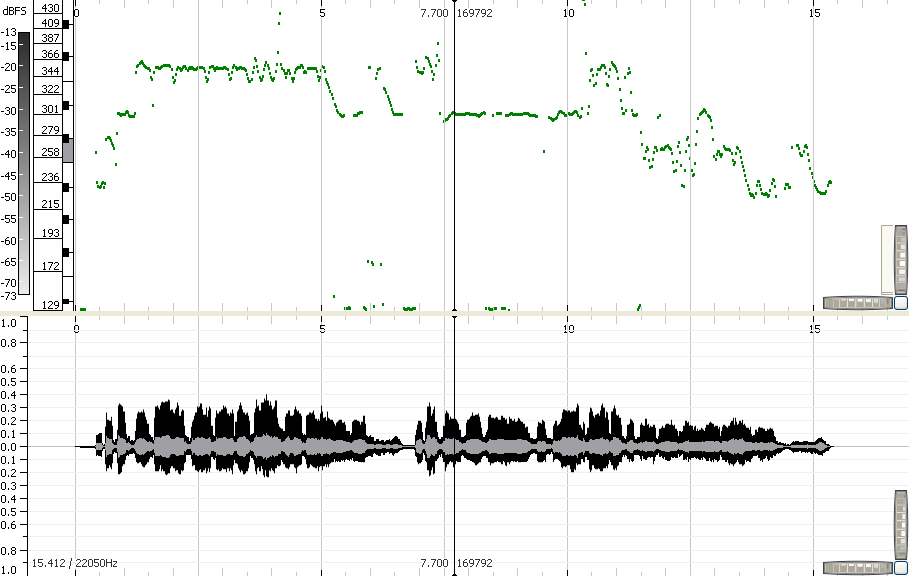
Here is the image of even a shorter clip of my sample.
The sample file is here
http://www.sendspace.com/file/buud46
at ~ 10 sec -387 Hz- P
10.8 -325 G
11 -387 P
12 - 437 D
In the sample the gamaka goes like P....GPGPGP for "rAma" in raghu rama in the song brova bharama. traversing gmp..the :notation is M for ma- ADDED
Also note 15 sec you have "G" at 327 hz and at 15.6 sec "M"-355 hz -you have a small gamaka GMGM sliding into "S" at 17 sec- 260 Hz - FOR "raghu rama" in the clip.
Note I placed a black dot at "G" and you can see the frequency and time on the right on top corner of the image for reference.
Now listen to the other clip I posted and enjoy the reference points.
I hope I am right. Right now I am only imagining the swarasthnas I played listening to my own clip.
Arun, others
I have a little trouble exporting image. It turns grey when I save ? why? The image I posted is a print screen. Any tips?
Last edited by Suji Ram on 24 Jan 2008, 01:54, edited 1 time in total.
-
arunk
- Posts: 3424
- Joined: 07 Feb 2010, 21:41
Export to image (under File menu) doesnt work as well for our use - it only exports the "current layer". So even if you are viewing pitch curce from within the spectrogram layer (for better y-axis calibration), with the spectrum turned off etc., when you export, it will export the spectrogram (i.e. black on white, assuming that is your color scheme), and only that (i.e. no pitch curve).
Now you can tab over to the pitch detector and save it, but then that means the y-axis would change (i,.e. now longer the nice resolution of the spectrum tab with keys etc.)
Arun
Now you can tab over to the pitch detector and save it, but then that means the y-axis would change (i,.e. now longer the nice resolution of the spectrum tab with keys etc.)
Arun
Last edited by arunk on 24 Jan 2008, 01:23, edited 1 time in total.
-
arunk
- Posts: 3424
- Joined: 07 Feb 2010, 21:41
the mA of raghurAma, I learned (i.e. my teacher labelled) as ma~ but may be at times singing as it an oscillation between ga and pa like you have done (sort of like begada ma). I think she said pa-ma, pa-ma
Maybe I should ask pitchappa as he also learnt the same version
Arun
Maybe I should ask pitchappa as he also learnt the same version
Arun
Last edited by arunk on 24 Jan 2008, 01:47, edited 1 time in total.
-
Suji Ram
- Posts: 1529
- Joined: 09 Feb 2006, 00:04
You are right! According to the notation it is "M"arunk wrote:the mA of raghurAma, I learned as ma~ but I am sure sing as it an oscillation between ga and pa like you have done (sort of like begada ma).
Arun
The gamaka traverses gmp that's what is CM all about...
Now, I am learning without a teacher....hope this software can help me learn by uploading a reliable recording of this song.
"Pitch-appa" is always welcome to sing this piece for us.
Last edited by Suji Ram on 24 Jan 2008, 01:52, edited 1 time in total.
-
cmlover
- Posts: 11498
- Joined: 02 Feb 2010, 22:36
Very nice Suji!
I literally had a treat listening to the audio gamaka with the visual.
The GPGP sounds so sweet when one can see it happening. I will run it on the software and play the selection to follow closely. (Now I am playing them separately!). The subtle GMGM which lasts less than 0.5 secs can be relished using the visual. These fine gamakas will be missed when you listen to the music fast but the beauty of CM is in these fine prayogas. Thanks to you. Just noticed that the climb between 12 to 13 shown in the graph is not noise but 'nOkku' for the Pancamam to follow is very elegant. This is a great educational software.
I would love to see 'pitchappa' execute the same phrase vocally!